
What does the heart rate trace across a HYROX race look like?
A plateau, reached early. The per-segment figure in the only peer-reviewed measurement of a simulated HYROX race shows heart rate rising steeply from rest through the first run. It levels off at the first station and holds inside a narrow band to the finish. Differences between adjacent segments are a few beats, far smaller than that opening rise. No run stands out, in either direction. The race high is the wall balls, the eighth and final station.
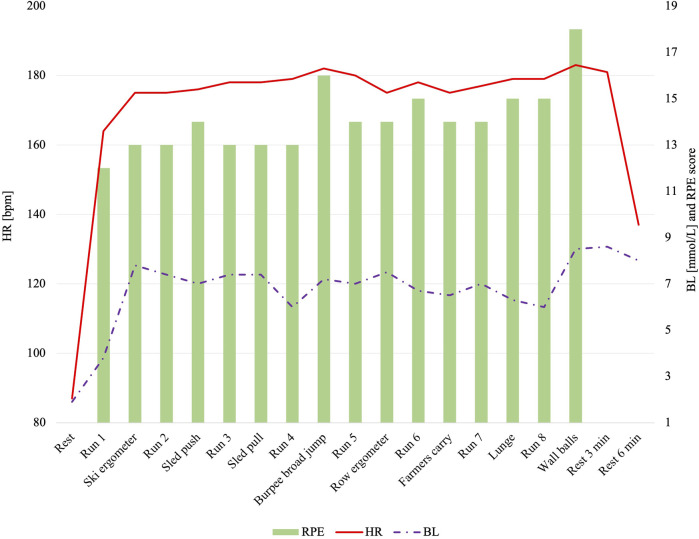
Coaches' own race analyses agree on the sustained intensity. A published analysis of a competitive athlete's real race describes her at or above threshold for virtually all of it. A Dutch coach's simulation shows a flat pattern across the runs.
The wall balls are the race high, not the final run before them. One published per-segment table has that ordering the other way around, and the figure doesn't support it.
That race was simulated solo in a gym, not run in competition. In measured terms, the plateau sits near the top of the intensity range. Pooled, heart rate runs higher at the stations than on the runs. The segments themselves follow the race's alternating structure of eight runs and eight stations.
Why doesn't your heart rate come down when you start running?
Because you never stopped moving. Heart rate falls when the drive to the heart falls, not when the metabolic cost of the work falls. That drive stays up as long as the muscles keep working. In a controlled comparison of recovery from one supramaximal effort, heart rate at the fifth minute was 121.8 BPM after active recovery. Passive recovery put it at 106.2 BPM.
Starting a run off a station is active recovery, not rest. Whether heart rate eases once you settle in hasn't been measured. Coaches do track how quickly it settles.
Why does your watch show a spike the study's trace doesn't?
Because your watch reads at the wrist and the race study read at the chest, and the two agree least well in gym work. Measured against an ECG chest strap, a wrist optical sensor ranged from 17.5 BPM below it to 19.9 BPM above during gym work. On running the spread was tighter, 13.7 below to 14.6 above.
Typical accuracy is fine, at a mean absolute error no worse than 3 BPM. It's the outliers that matter, and gym work is where they come from. One landing in a station, or in the first strides after it, is a spike nothing in your cardiovascular system produced.
The peaks in the mid-220s athletes report on race runs sit above any plausible maximum for a recreational athlete. A sensor artifact is the likeliest explanation, though this comparison's spread doesn't by itself reach that far.
How do you lower your heart rate during a HYROX race?
First, pace the first kilometer, because that's where the plateau gets set. Heart rate reaches its plateau by the end of the first run and holds there for the rest of the race. So the opening kilometer is the one segment where the level of the whole race is still negotiable. Go out at a pace you'd be happy holding fresh, and the level you settle at is the one you carry.
Second, don't chase the number mid-race. The published figure never comes back down before the finish, so there's little to chase. Third, and this one happens before the race: check whether your device is telling you the truth.
Holding that opening pace is a trainable skill, and it's the same one an easy run trains. You leave the pace alone while it still feels too easy. That's the execution problem RunBeat's Zone Training is built for. It reads your heart rate live and steers you by sound, so you practice holding a target without watching a wrist.
For training, set the target from the Zone 2 range and the formula it comes from.
Chest pain, dizziness, or anything that doesn't feel like ordinary training discomfort is a reason to stop and see a doctor.
Sources
- Brandt T, Ebel C, Lebahn C, Schmidt A. Acute physiological responses and performance determinants in Hyrox© – a new running-focused high intensity functional fitness trend. Frontiers in Physiology. 2025;16. doi:10.3389/fphys.2025.1519240. 11 recreational athletes, simulated Individual Open race; values are medians. Source for the per-segment trace and the chest-strap measurement. The paper plots every segment but draws no conclusion from the plot, describing no trajectory and comparing no run against another. So this page states the shape and no per-segment BPM, and the first-kilometer pacing advice is this page's reading of that shape, not something the study tested. Figure 5 reproduced above unmodified under CC BY 4.0.
- Crisafulli A, Orrù V, Melis F, Tocco F, Concu A. Hemodynamics during active and passive recovery from a single bout of supramaximal exercise. European Journal of Applied Physiology. 2003;89(2):209–216. PMID 12665987. 8 male amateur soccer players. Source for the active-versus-passive recovery figures and the mechanism, paraphrased. Measured after cycling, not after a HYROX station, so the direction transfers and the size of the gap doesn't.
- Sartor F, Gelissen J, van Dinther R, Roovers D, Papini GB, Coppola G. Wrist-worn optical and chest strap heart rate comparison in a heterogeneous sample of healthy individuals and in coronary artery disease patients. BMC Sports Science, Medicine and Rehabilitation. 2018;10:10. doi:10.1186/s13102-018-0098-0. 199 healthy volunteers, 371 hours, 18 activities. Source for the limits of agreement by activity. The wrist device was a 2018 research prototype, so the pattern carries across but the exact numbers belong to no watch you can buy. No study we found isolates why the spread widens in gym work.
- 80/20 Endurance (Matt Fitzgerald), HYROX run training: published race analysis of HYROX athlete Skyler Allen, cited for the qualitative observation only, not for any figure.
- A Dutch coach's published HYROX race simulation with segment-by-segment readings. Cited for the existence and direction of the pattern only, never for a number. Deliberately not named: the site blocks automated fetch, so no direct read was obtained, and its readings are spot values from a protocol its author describes as not race-specific.
- Athlete self-reports of race heart rate on r/hyrox and r/Garmin, including peaks in the mid-220s. Community evidence for what athletes report, not a measurement.
- An unnamed published per-segment %HRmax table that rates the final run above the wall balls. This page corrects that ordering and sources nothing to it.
- HYROX Rulebook Single, Season 26/27. HYROX World GmbH. Source for the race format: eight run segments of approximately 1,000 meters each, alternating with eight workout stations.